

I’ve been working on my visualisation skills in Tableau with some online courses. Here are several dashboards I created along the way. Just to keep my memory fresh.
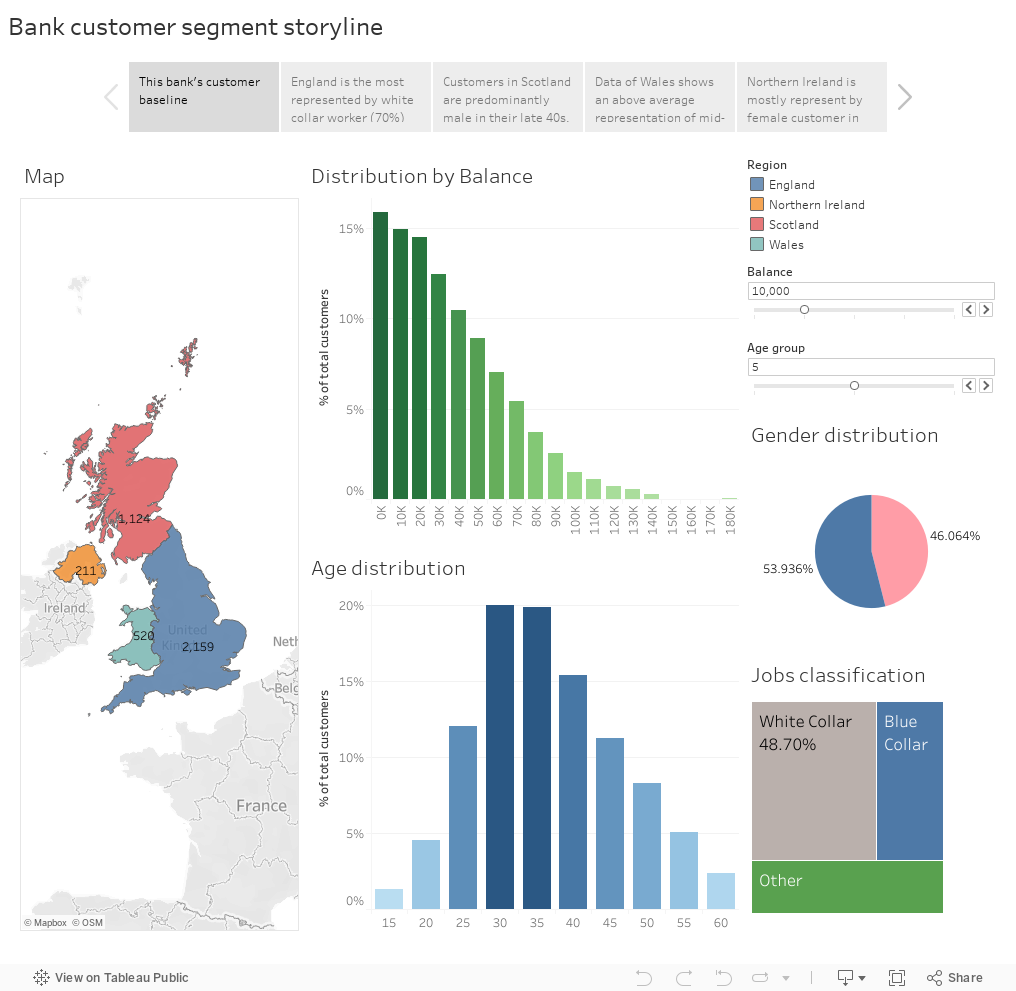
The following visualisation involve using bin to categorise age and balance into groups. User can use the slider to select the size of bins. Actions have been setup in the dashboard for interaction, filtering according to the selected category.
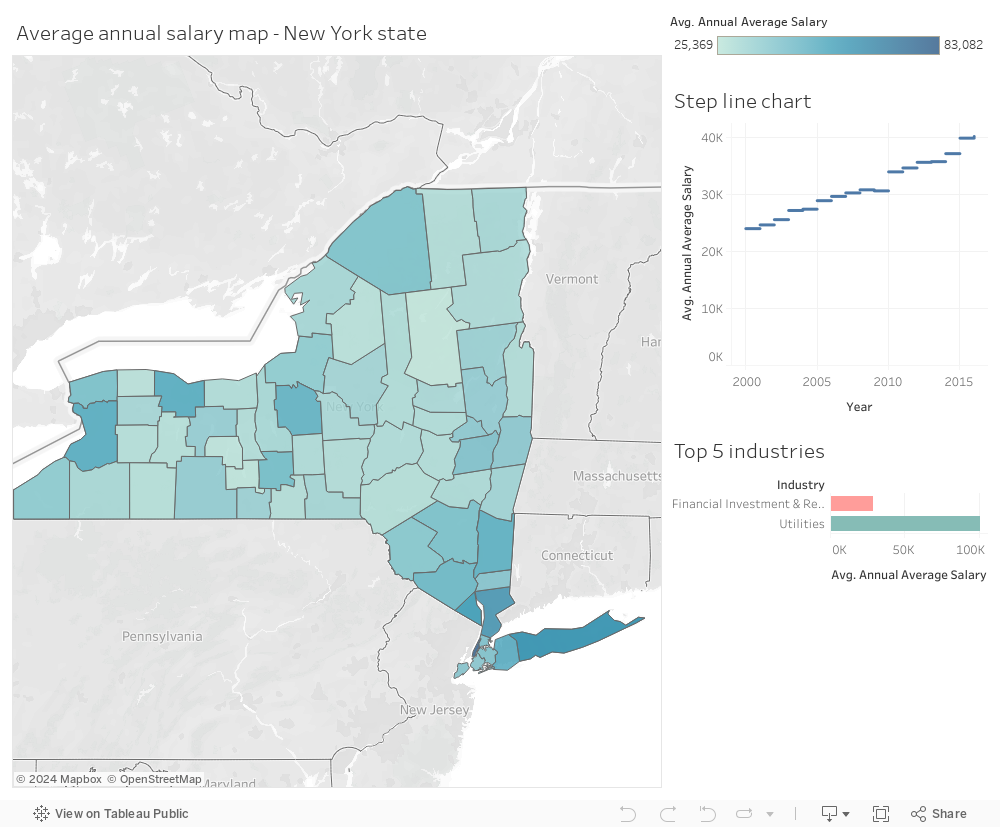
Moving on to the second viz, I connected a PDF as source of data to Tableau. And I also connected a spatial files to Tableau to supplement location data, so that we can create a map in the dashboard. We make use of the step and jump line to indicate the increment of the salary data. The visualisations are also added to the tool tip for easy reference on the data in each county in New York State.
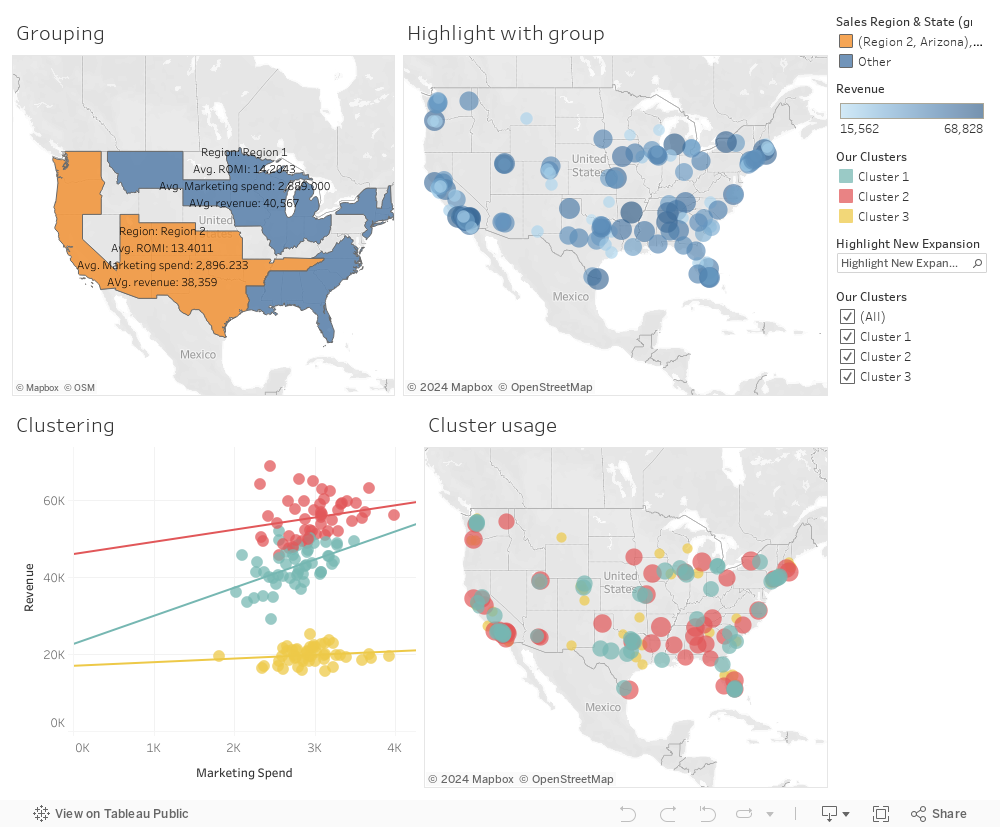
In the final visualisation, we created custom territories using manual selected groups and by geographic roles. After creating the regions/groups, we created a highlighter to for user to highlight the new/old city. With the data we have, we also created a cluster using Tableau. With the cluster we can view the different segments in the data to find our the groups that have highest return on marketing spent. Combining with the new/old city data, we can suggest to the business which of the new cities the company should invest more in marketing to boost sales.