


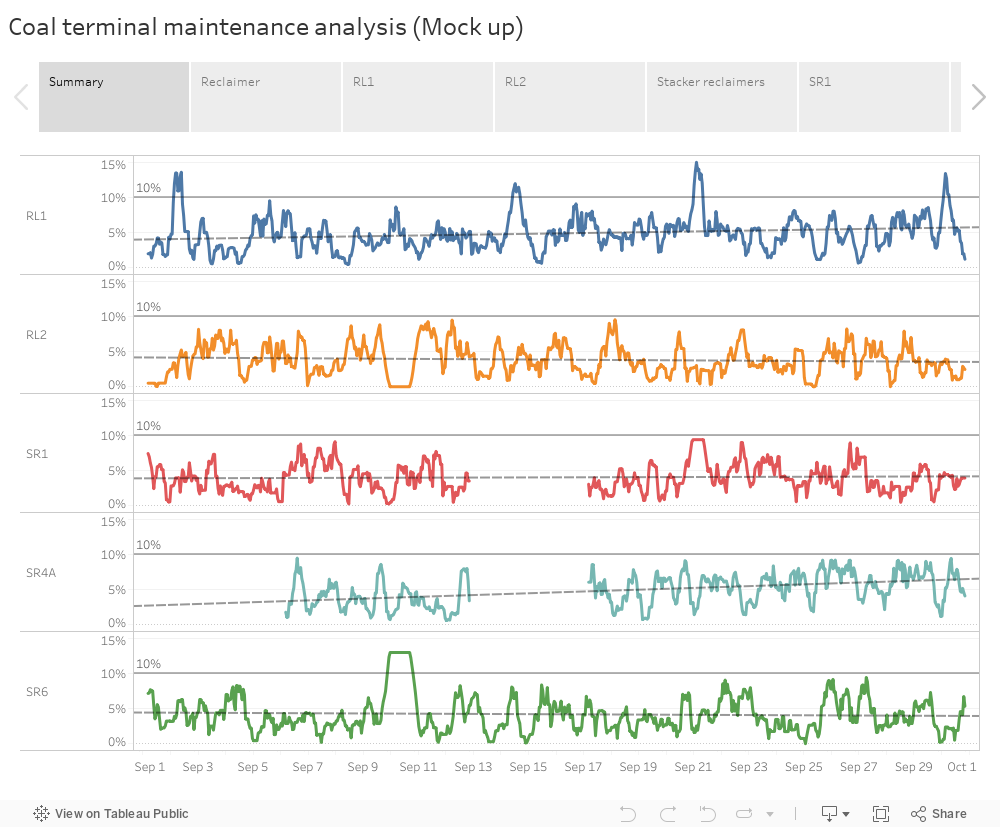
In this viz, I applied the skills of using table calculation in Tableau to create analysis on coal tractor capacity
From raw data, we first get an aggregate sum of all the tonnes processed.
Then we use table calculation to get a & difference from the nominal capacity, apply down the table. It gives us the negative percentage of the machine usage. Then create a calculated field, multiple the original value by -1 to get a user-friendly positive value.
Apply a window average table calculation to get the weekly moving average across the table.
Finally we need to do quality check on the window average calculation. Use If then else in table calculation to ignore calculation if window does not have enough data. Having insufficient data in the window will cause inaccuracy in the moving average value
IF (WINDOW_COUNT([Idle capacity percent pos], -7,0) = 8)
THEN WINDOW_AVG([Idle capacity percent pos], -7,0 )
ELSE NULL
END
In the viz we can also show trendlines for seeking insights from the data.