

Just to keep my memory fresh.
First we use sets to categorise the part of data that you want to highlight. Then assigning the set to colour/size/shape.
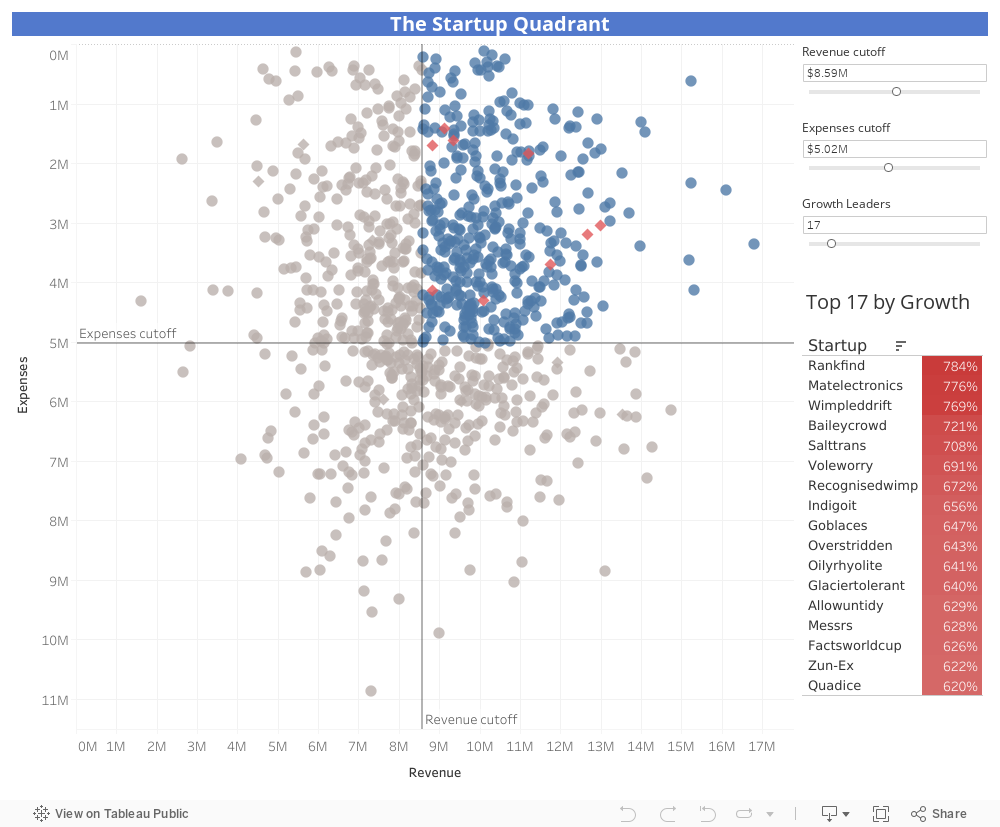
When editing sets, we can set the criteria using manual selection, or using condition with operators (> / < ). We can also set to include the top certain amount in a parameter, e.g. Top 10 by growth.
After setting up the parameter, we can setup dynamic set by allowing user to input the parameter value, and set the condition in the set using this parameter.
Or even using the parameter to setup a formula under condition when editing set.
SUM([2015 Revenue]) > [Revenue cutoff]
With multiple sets, we can combine them to include only those data that satisfy conditions in both of the sets.
For easy reading of the graph, we can add reference line with parameter value and using drop lines to highlight the value.