
Try to find the safest neighborhood in London.
1. Get crime raw data from London Datastore
No better place than getting the crime data from the authority and I discover that London Datastore has all the crime data.
https://data.london.gov.uk/dataset/recorded_crime_summary
MPS LSOA Level Crime (most recent 24 months)
2. Importing the crime data to BigQuery
Since the combined crime data is over a hundred MB, we need to first upload it to Cloud storage then import the file to BigQuery. Let’s create a bucket and upload the data file to the bucket.
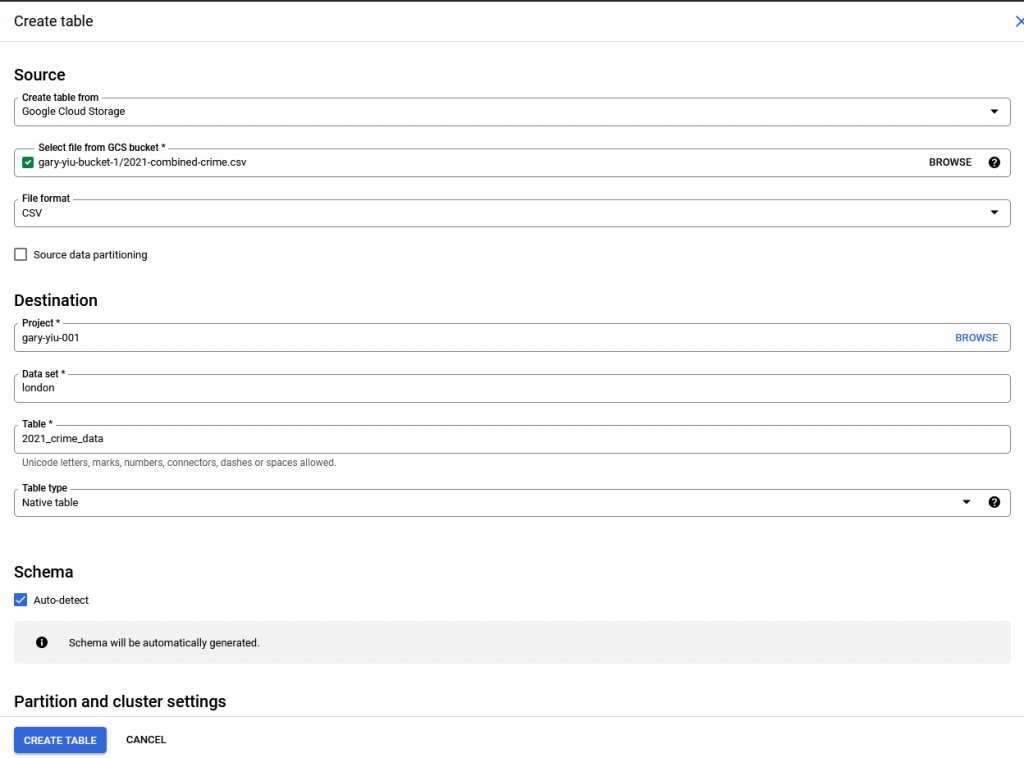
Then we can create a BigQuery table by using the data in the bucket as source. Select auto-detect for schema.
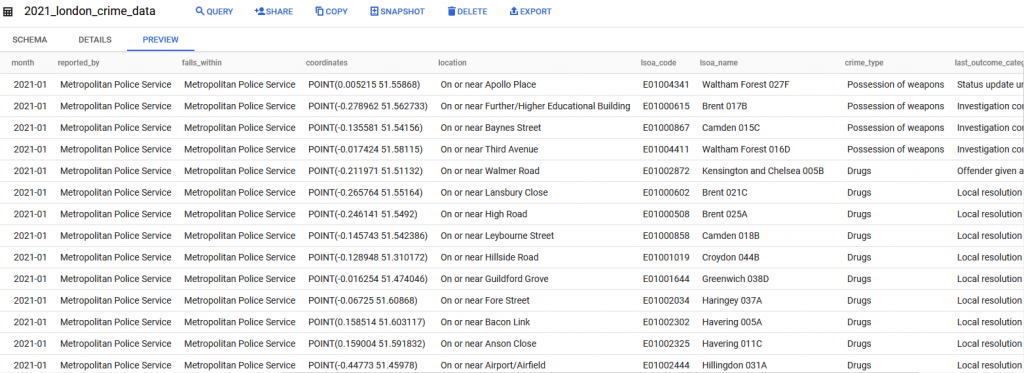
Preview the data after creating the table. We can see not all the fields are useful for our analysis.
SELECT * FROM `gary-yiu-001.london.2021_crime_data` LIMIT 1000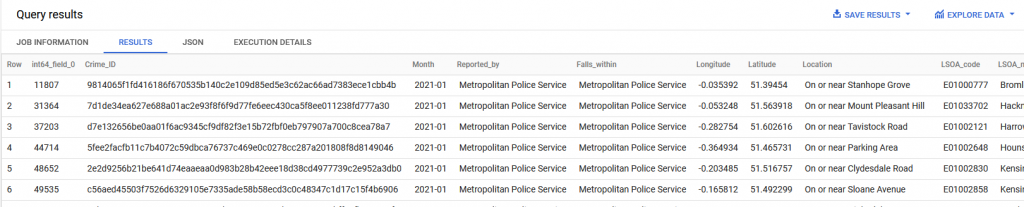
Let’s select only the relevant fields and store it in another table. At the same time, combine the latitude and longitude to a coordinate which BQ recognize as GEOGRAPHY type data using ST_GEOGPOINT function. Before running the query, configure the query setting to write the query result to a new table – 2021_london_crime_data. Pick “Overwrite table” in preference.
SELECT
  Crime_ID crime_id,
  Month month,
  Reported_by reported_by,
  Falls_within falls_within,
  ST_GEOGPOINT(Longitude, Latitude) coordinates,
  Location location,
  LSOA_code lsoa_code,
  LSOA_name lsoa_name,
  Crime_type crime_type,
  Last_outcome_category last_outcome_category
FROM
  `gary-yiu-001.london.2021_crime_data`
order by 2 asc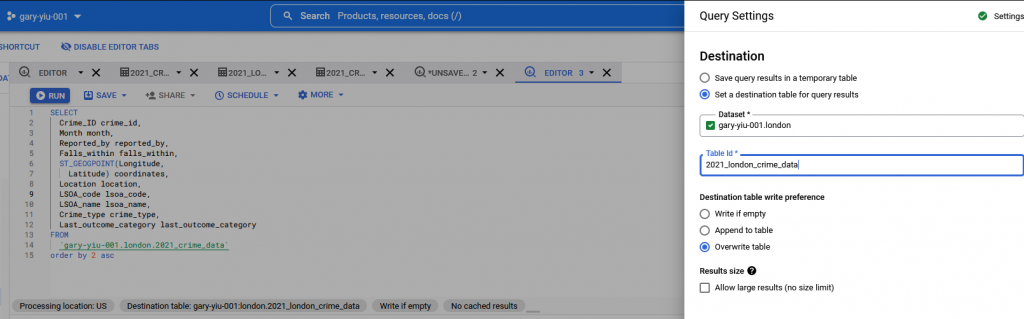
3. Aggregate our data
Now we have our data imported, let’s aggregate the data by month level before visualizing it for insights. For visualization, we need the polygon of each LSOA and MSOA zone. So we are using the LSOA polygon and left-joining both MSOA polygon and the crime data.
For the polygon data, I’ve covered how I created the polygon data from a shapefile which I acquired from London authority here.
I like to store it as an aggregated view so we can setup a schedule query using the view but it’s not required to achieve what we’re doing here.
SELECT
  ls.LSOA11NM lsoa_name,
  LSOA11CD lsoa_code,
  ls.MSOA11CD msoa_code,
  ls.MSOA11NM msoa_name,
  ls.LAD11CD lad_code,
  ls.LAD11NM lad_name,
  polygon lsoa_polygon,
  ST_GeogFromGeoJson(ms.geom,
    make_valid => TRUE) msoa_polygon,
  c.month,
  crime_id,
  coordinates,
  crime_type,
  last_outcome_category
FROM
  `gary-yiu-001.london.london_lsoa_polygon` ls
LEFT JOIN
  london.london_msoa ms
ON
  ls.MSOA11CD = ms.MSOA11CD
LEFT JOIN
  `gary-yiu-001.london.2021_london_crime_data` c
ON
  ls.LSOA11CD = c.lsoa_code
4. Scope and clean our data for MSOA level
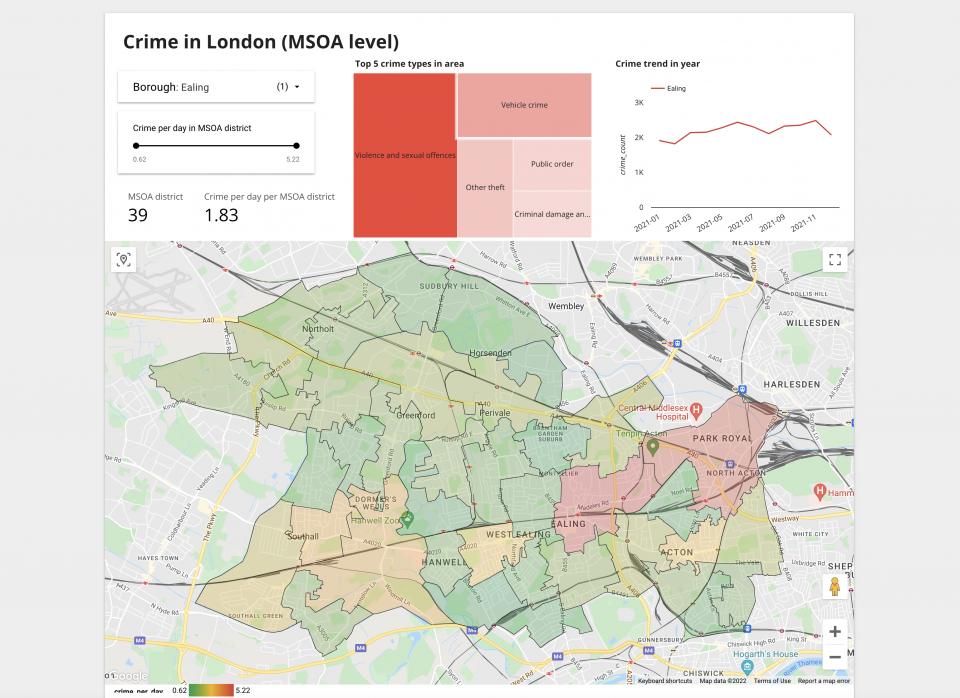
Selecting the data from our aggregate table and calculate the average crime per day over the year. We have a simple enough data structure to visualize the data having the borough name, MSOA name and code, MSOA polygon and the crime per day number. Continue to another post where I use these data to build a dashboard in data studio for visualization and finding more insights.
WITH temp AS (
SELECT
  lad_name,
  msoa_code,
  msoa_name,
  COUNT(DISTINCT crime_id)/365 crime_per_day,
FROM
  `gary-yiu-001.london.london_crime_agg`
WHERE month IS NOT NULL
GROUP BY
  1,2,3
ORDER BY
  1 ASC, 2 ASC
)

SELECT
    temp.*,
    ST_GeogFromGeoJson(ms.geom, make_valid => TRUE) msoa_polygon
FROM temp
LEFT JOIN `gary-yiu-001.london.london_msoa` ms
       ON temp.msoa_code = ms.MSOA11CD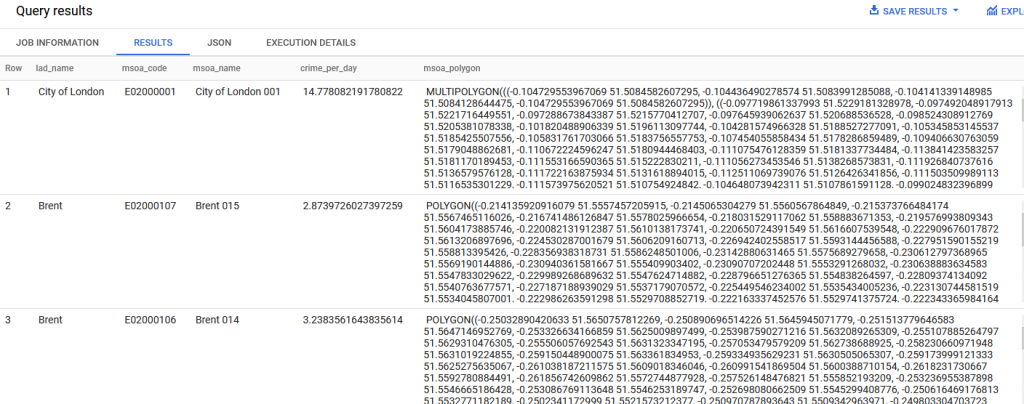
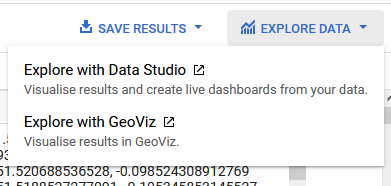
5. BigQuery Geo Viz
From the query result panel, we can select “Explore with GeoViz”. GeoViz is a visualization tool specific for Geography type data by Google.
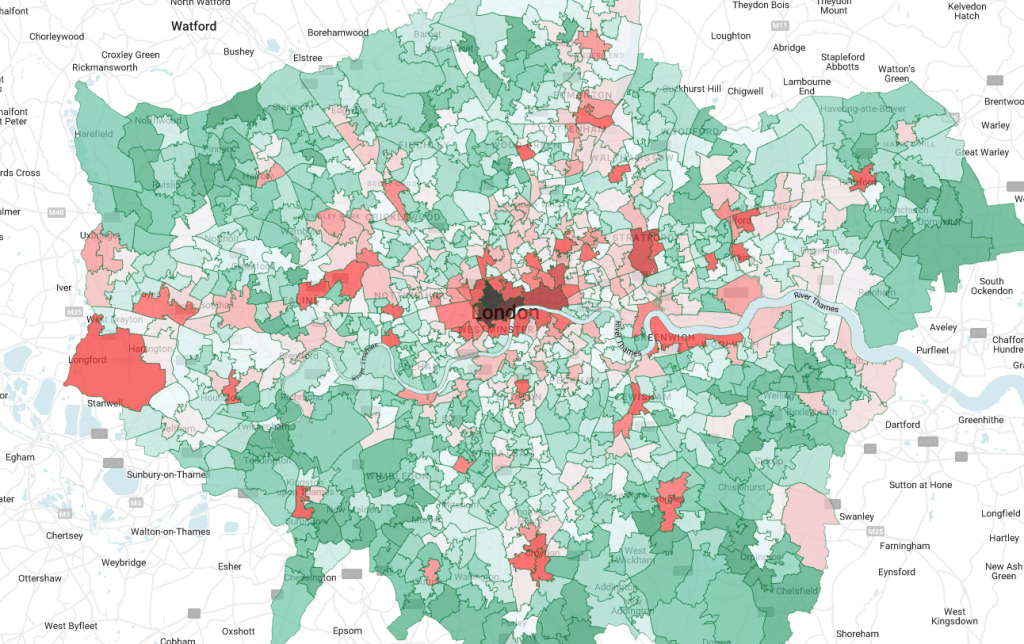
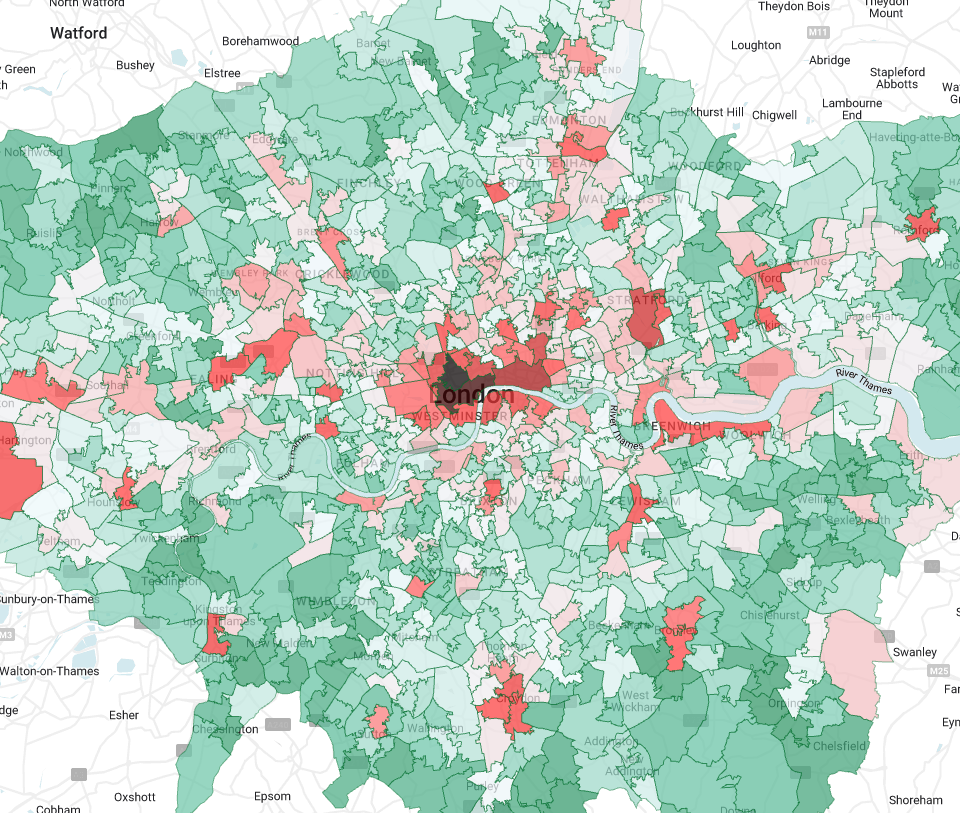
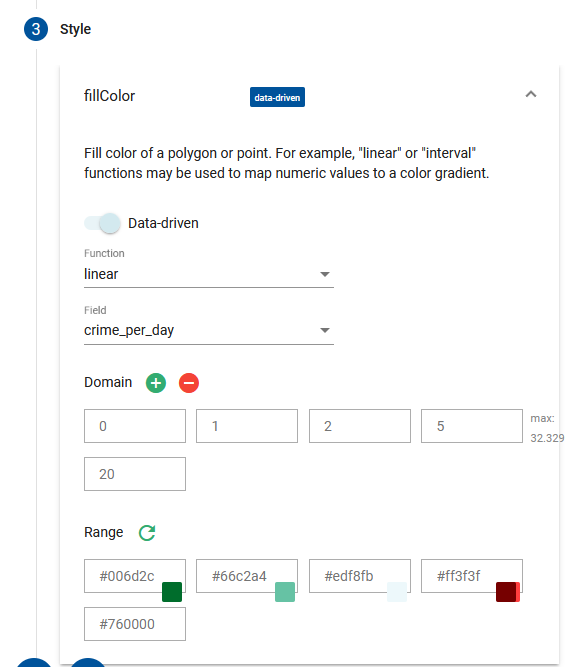
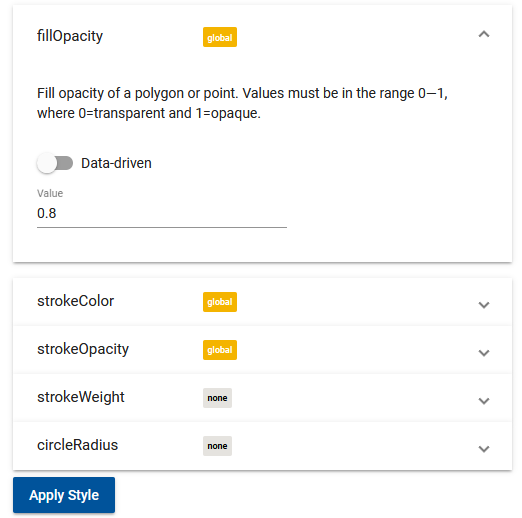
In the setting panels on GeoViz, we can keep query and data section as default as GeoViz would auto-detect the polygon field in our data. We only have to configure the style of the visualisation such as using crime per day to show a color gradient highlighting the district with higher crime rate.
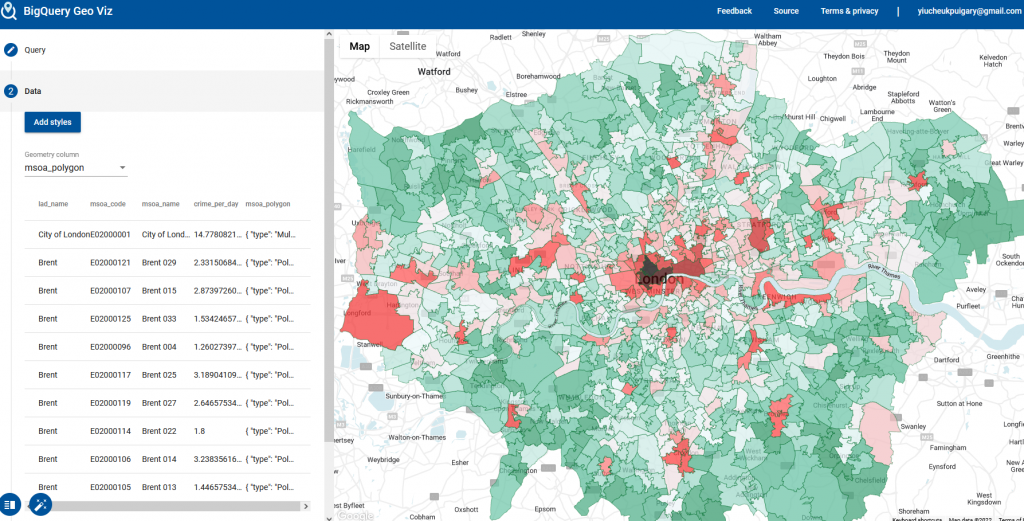
After configuring the visualisation, we can see clearly which districts have a more serious problem of crime and which are relatively lower in crime rate. We are not done with the data as there are more insights available but we shall continue in another post where we will use the data in Data Studio for more visualisation and finding insights from within.