


A non-real world data on a company that owns store across USA and we want to know how they perform.
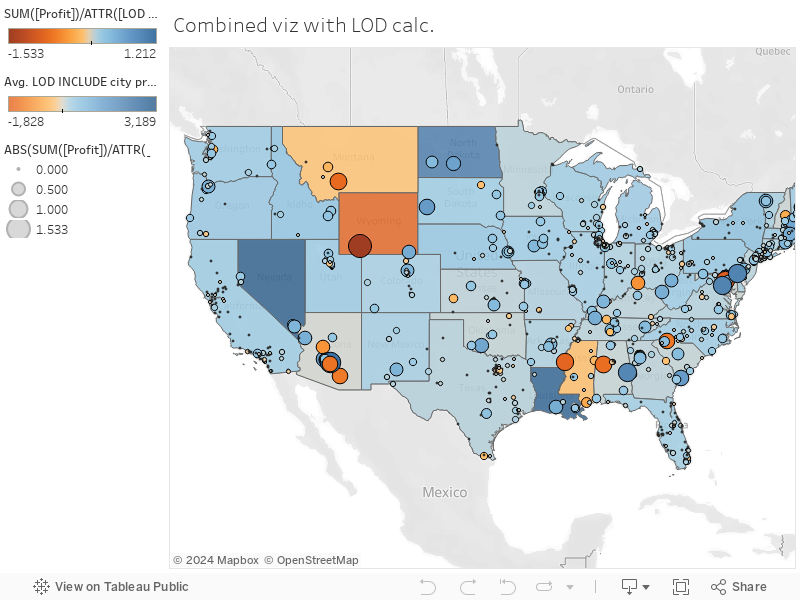
In this exercise, we want to show the profit of the stores across the country in different states. We want to display the overall profit/loss on a state level, as well as showing the profit/loss on the city level. As the data is a single table which in each row contains the state and city information, we have to join the table by itself and do some calculation on different level of details, then paste the calculated field on different dimension to show it in the visualisation.
There are 3 types of LOD calculation
- INCLUDE create calculated field, { INCLUDE [city] : SUM([profit]) }
- EXCLUDE create calculated field, { INCLUDE [city] : SUM([profit]) }
- Show on viz as ATTR as it is coming from higher level on granularity
- Calculate using the ATTR e.g. SUM([Profit])/ATTR([LOD Exclude state profit])
- To show a proper size, use ABS to get absolute value e.g ABS(SUM([Profit])/ATTR([LOD Exclude state profit]))
- Mindful of false positive when dividing negative number e.g. SUM([Profit])/ATTR([LOD Exclude state profit])*SIGN(ATTR([LOD Exclude state profit]))
- Multiple fields are allowed in LOD calculation e.g. {EXCLUDE [City], [Postal Code]: SUM([Profit])}
- FIXED
SUM([Profit])/ATTR([LOD Exclude state profit])*SIGN(ATTR(LOD FIXED state profit]))