

Introduction
The City of Chicago has made the taxi trips data available to public since 2013. More than 100 million rides from 2013 until 2021 are all recorded in this dataset. Google has made this public dataset available in BigQuery for the public to do analysis with.
Let’s take a look at the data and see what insights and trend we can find from the usage of taxi over the years in Chicago.
Overview of Chicago taxi usage
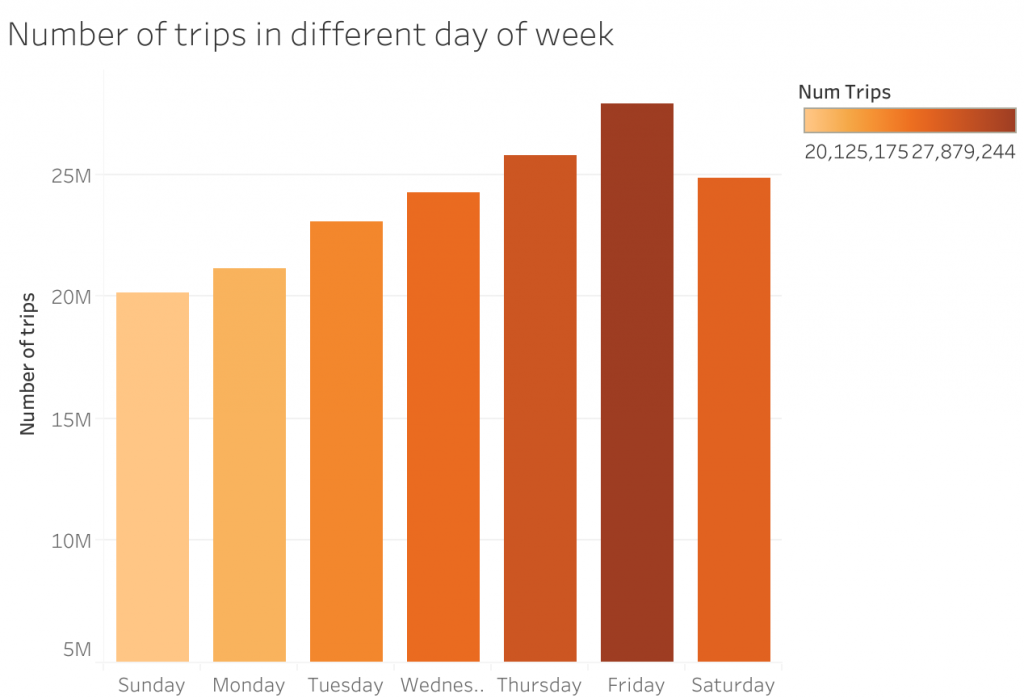
First we look at the overview of the taxi usage in Chicago. We can see from the data that historically there are more trips happening during weekend from Thursday to Saturday which is expected. Trips number peaks at Friday which has 30% more trips happening than a normal Sunday.
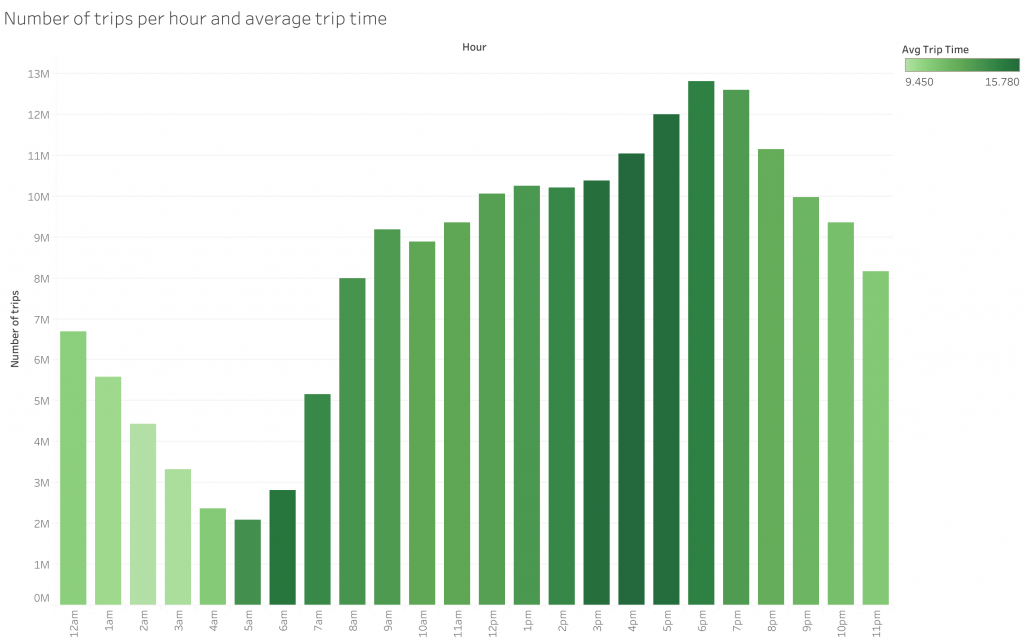
In any day of the week, we see a peak of taxi trips happening in the evening rush hour. Surprisingly, the morning rush hour doesn’t share the same peak.
The data is showing that rides in morning and evening are tends to be longer in distance which reflects riders are taking taxi to and from work in the rush hours which make sense on longer distance ride.
Taxi industry in Chicago is shrinking
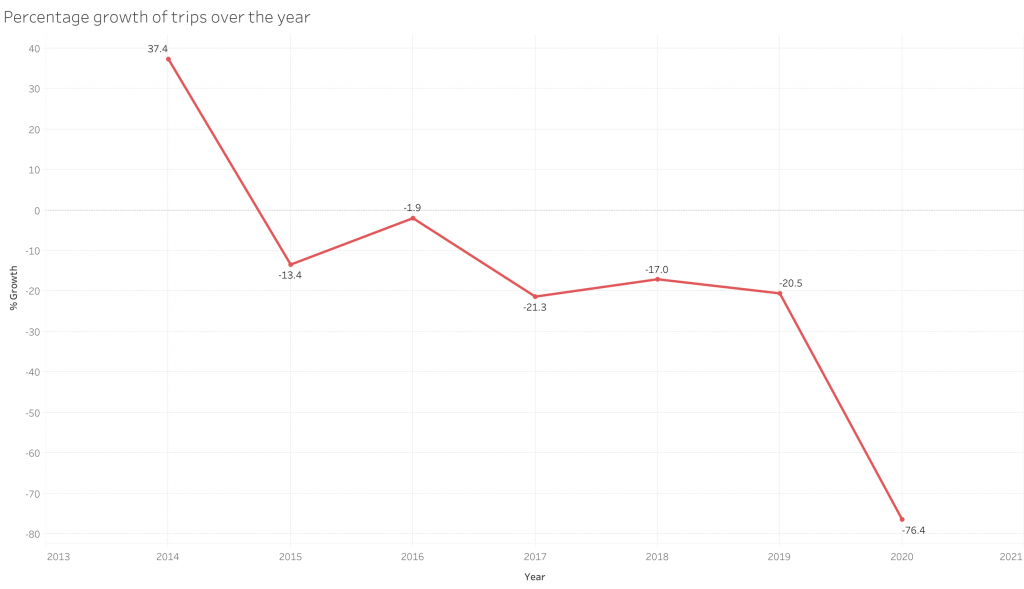
Digging a bit deeper into the trip numbers over the years. The data indicates that the Chicago taxi industry is shrinking faster than ever in recent years
There was a negative growth since 2015 for 6 consecutive years. It reaches a staggering 76.4% decline in 2020. Although the pandemic lock-down did play a role in the rapid decline with people staying and working from home more, the negative growth is already averaging 11.18 % over the period of 2014 to 2019. So we can safely say that the taxi industry in Chicago is a dying industry with the rapid decline.
Let’s try to see if the data on hand has any hint on why the industry is shrinking.
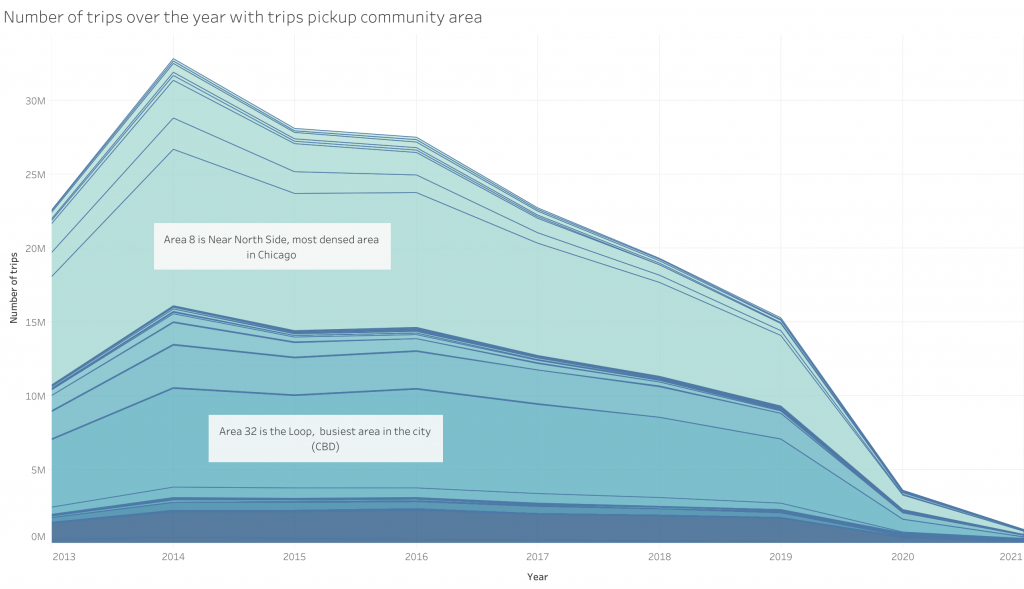
Chicago is divided into 77 community areas, some of these areas are the more popular locations to pickup taxi riders than other areas. Pickup area is simply the community area where the rider start their trips. Among these hot areas, 8 and 32 are the most popular. Area 8 is the Near North side which is the most dense area in the city. Area 32 is the Loop which is the central business district in the city. So it is reasonable that there are more riders in these two areas
Popular pickup areas shrink the most
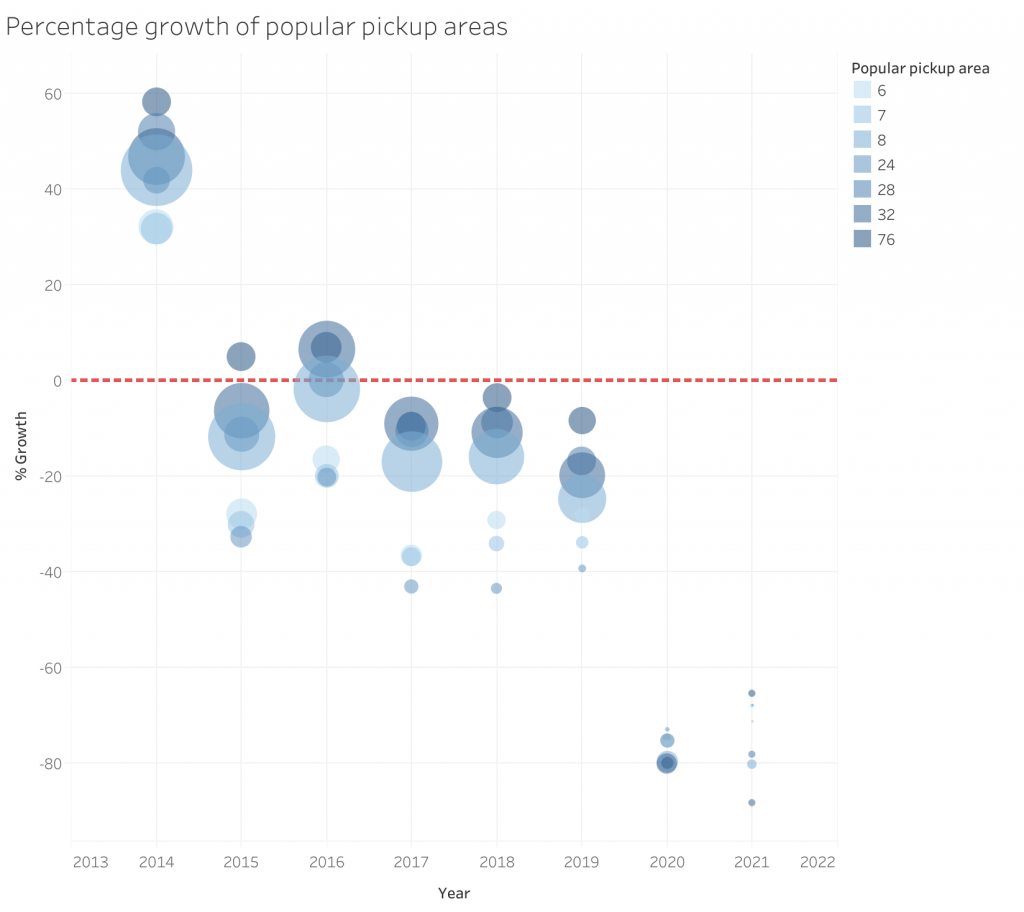
We shall take a look at how the number of pickup changes in these different areas over the years. The data shows that most of the hot pickup areas experienced a negative growth since 2015 which could well be the reason why the total trips dropped that much.
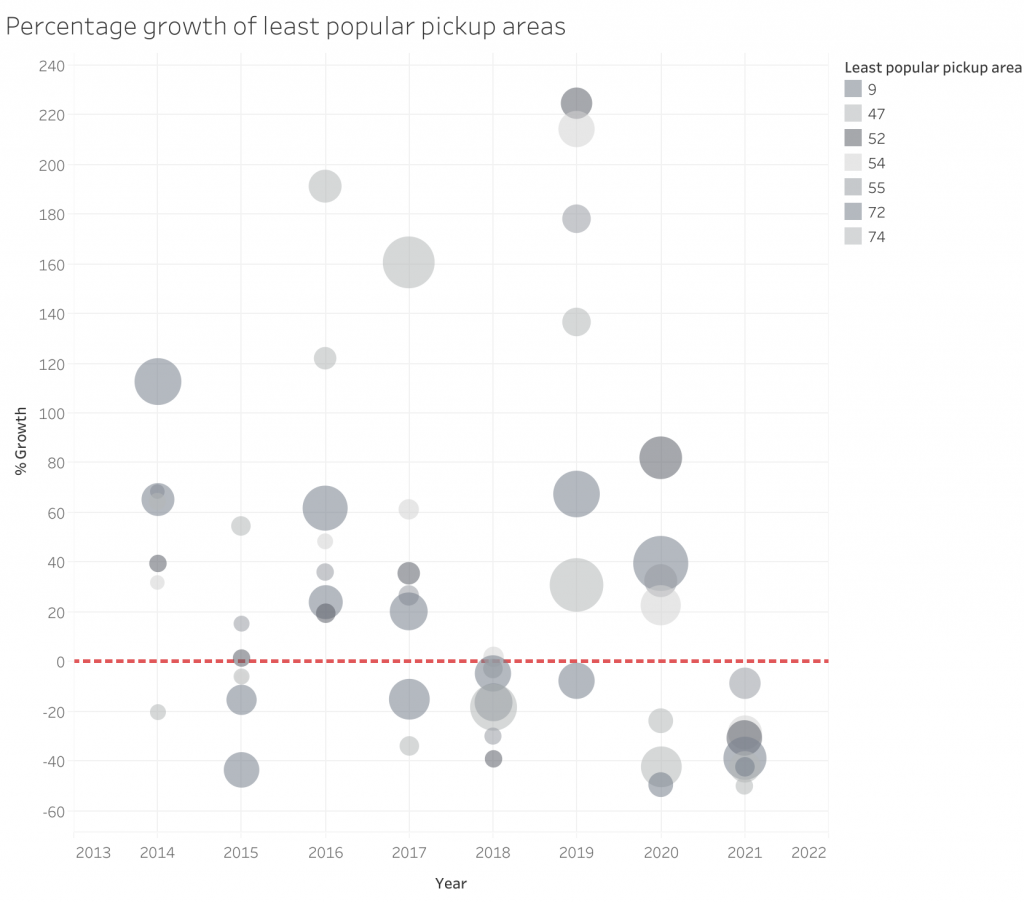
Surprisingly, while traditional hot pickup areas experienced negative growth, less popular pickup areas are showing more growth instead. We picked the 7 most popular and 7 least popular pickup areas to show it in the visualization below. We can see majority of the popular pickup areas lies in the negative zone but it is not the case in those less popular pickup areas.
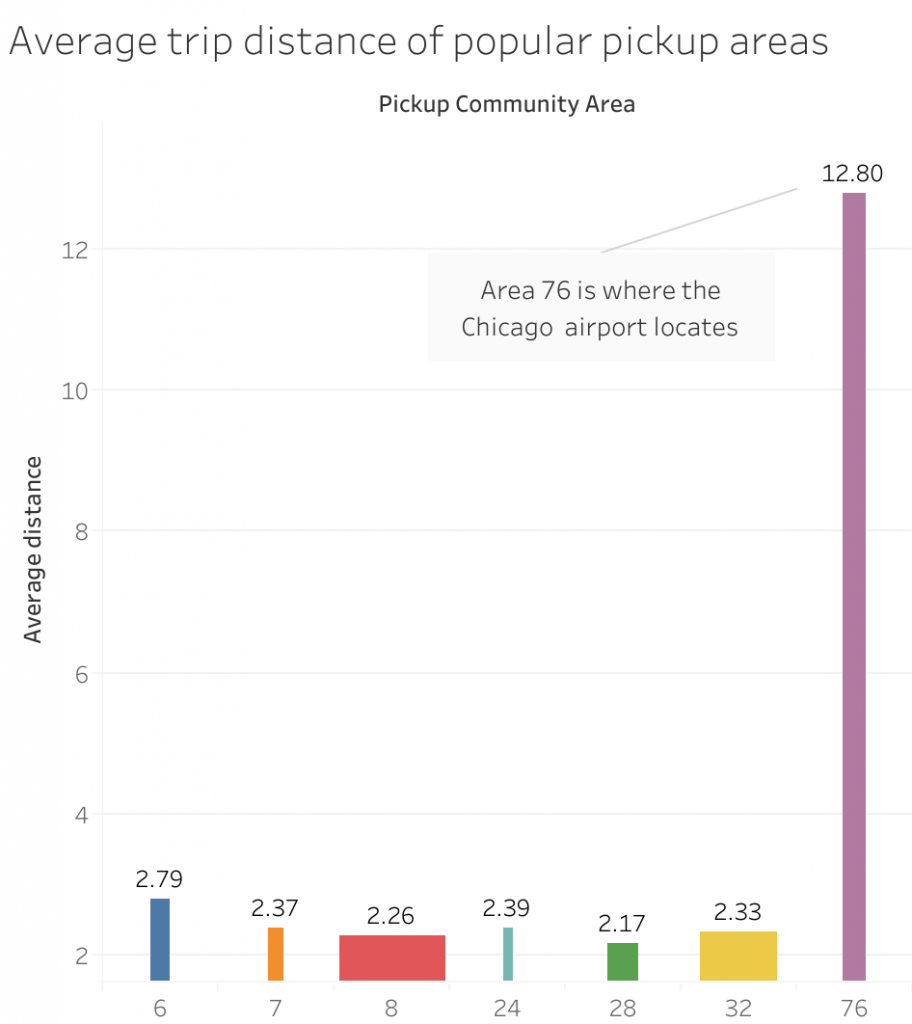
Then we investigate more on the trips originates from these hot pickup areas. While looking at average distance of trips, we can see the majority of rides from hot pickup areas are relatively short in range. Except for those trips from Area 76 which is where the airport locates, but it is obvious since the airport is distant from the city center.
Now we know the majority of the taxi trips are short ones. One possible reason that trips from the popular pickup area dropped that much is the rise of ride hailing services like Uber and Lyft which are easier for riders to request a ride for short-range trips. And these services are offering better experience for the riders as they can request a ride right from the mobile app.
Riders are going cashless in popular pickup areas
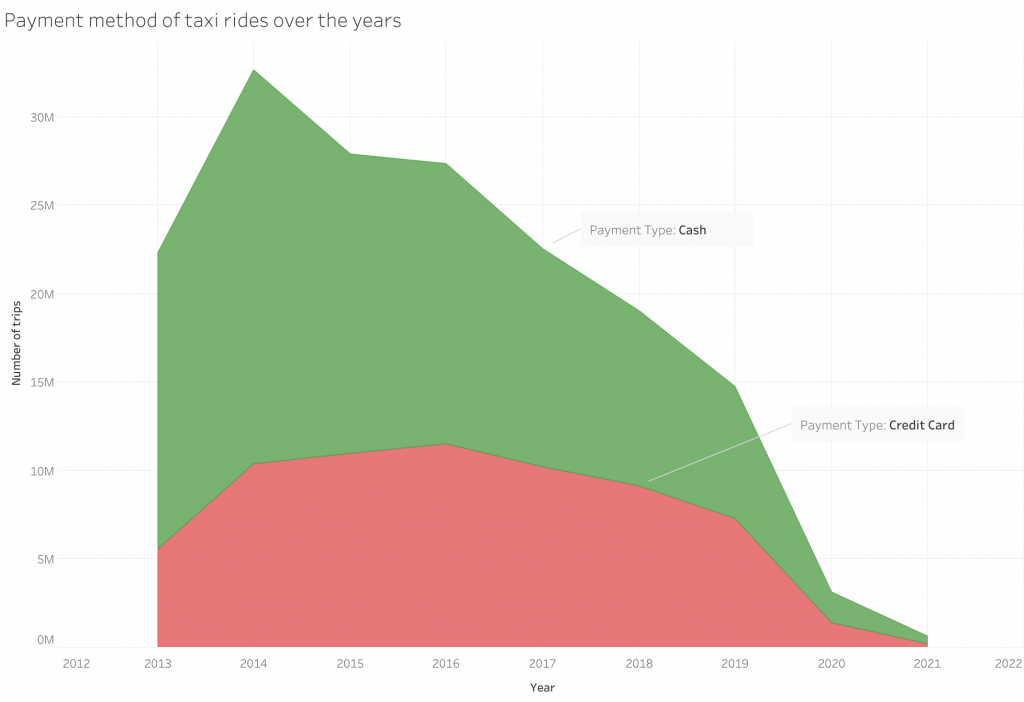
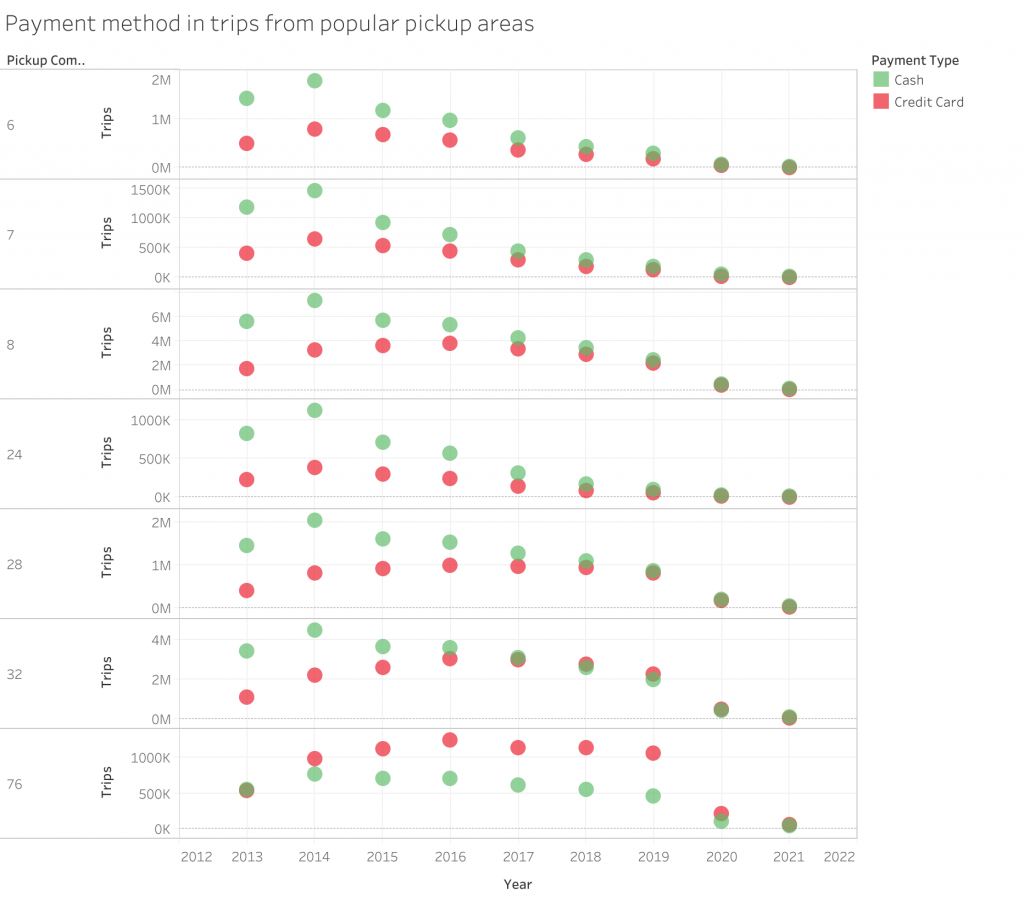
But there is more in the data to explain the declining trend of taxi than just better user experience of Uber and Lyft. Counting all the taxi trips, the riders who use credit cards to pay for taxi increase. And except for those riders from the airport, all riders from the rest of the popular pickup areas are using credit cards more over the years. It reflects change in user behavior from cash to cashless which benefits services like Uber and Lyft.
Conclusion
The switch in rider behavior to make use of mobile applications to request a ride is negatively impacting the taxi industry. This can be seen by looking at the payment method the riders are using on taxi rides. Credit cards are becoming more of the default option when people pay for rides. Mobile and cashless services such as Uber & Lyft take advantage of the trend by making it easier for the rider to call a ride. While taxi would still be an important travel option in Chicago, its importance is a lot less than it used to be.
To explore more on the taxi usage trend, we can dig deeper on the popular routes usage over the years and also take a look at the change of revenue particular taxis are generating to see if there’s more the data can tell us.