


In this exercise, I’m using a real world data source to practice my viz skills in Tableau.
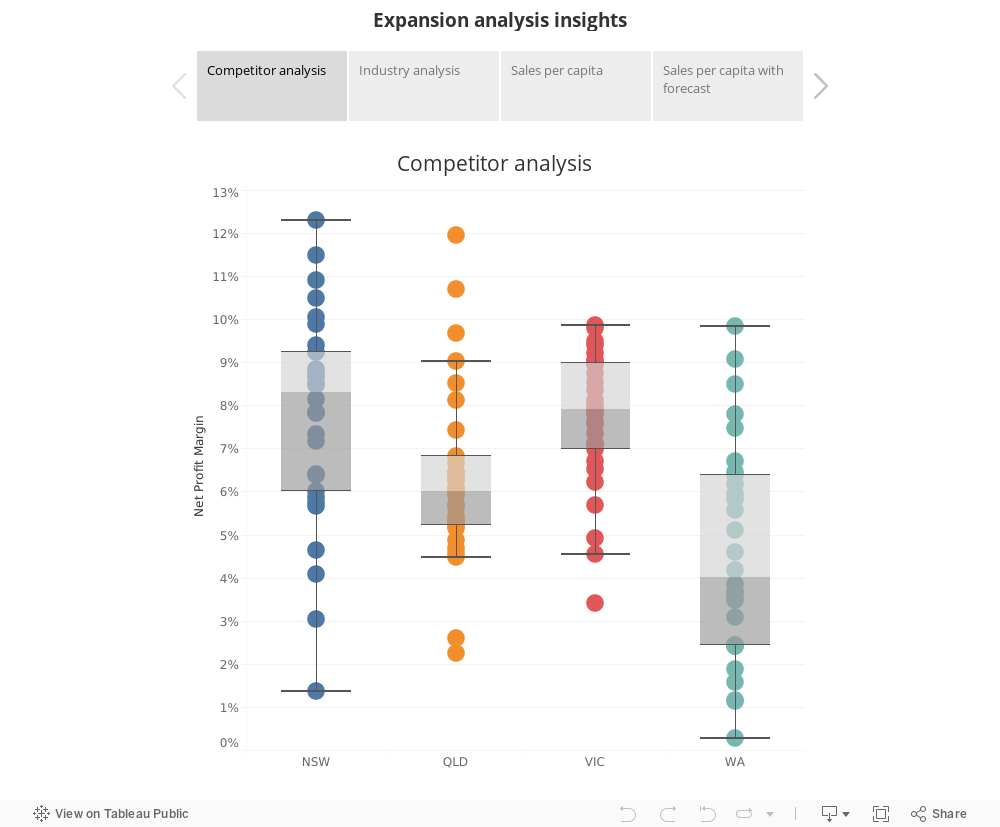
To start with, we use box plot to have a general idea on how each state perform and the certainty of the historical data. The wider the box plot is, the higher the volatility is. The narrower box plot provide more certainty on the insights from the viz.
Since we are importing a huge amount of data(million roles), using filter in connection level to make analysis faster. After we did the setup, then we can input the rest of the data to complete the analysis.
Blending with another data source to connect the population data to make the analysis relevant according to the population in each state.
In blending option, we choose using year and quarter to blend as the second data source(population) report on quarterly basis.
Adding trend line to have overview on how different state perform. In tableau we can also add a forecast to let tableau estimate the future trend based on the historical data. It is quite useful, we can even select the prediction interval in forecast option to show the accurate prediction, however, higher accuracy will increase the shade area.